Texas Hold-Em; An Evolutionary Approach: Part 4
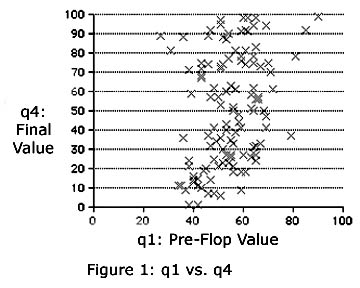
What I mean by using the term ‘mesh’ is how the combination of his hole cards and the cards on the table make a good hand. Being able to use both hole cards is better than using only one. Over time, I suppose, a player can get really good at making judgments about the quality of a hand. But as we discussed, it would take a very long time for a computer to be able to use experience to come up with all of the rules and factors needed to make such judgments, even if it could be done. Today, we look at a better way. Let us also work backwards, starting with the ‘q’ to be calculated at the final round of betting when all five table cards are showing. Call this q4, since it will occur at the fourth round of betting. This value will represent the probability that a particular hand with two hole cards and 5 table cards would win against a randomly drawn pair of hole card that an opponent might have. A q4 value of 0.95, or 95 percent, would say that there is a 95 percent chance of winning against the random opponent. Now, back up one step to the ‘turn’ when 4 table cards are showing. We can calculate a value, ‘q3’ which represents that same idea but for the third round of betting. We are now evaluating against a randomly drawn pair of hole cards held by an opponent plus a randomly drawn fifth table card, called the ‘river.’ Similarly, the value ‘q2’ is calculated for the second round of betting, called the ‘flop’ when three table cards are showing. Finally, the value ‘q1’ is calculated pre-flop, at the first round of betting, when no cards are on the table and each player is betting on only the two hole cards. These four values, q1, q2, q3 and q4 are calculated for the same set of players’ hole cards for each round of betting. Each q value is determined by simulating a number of deals at each betting stage and counting the number of wins and losses. The number of simulated games can be varied, and the greater the number the greater will be the accuracy of the predictions. I have used numbers from 20 to 1,000 in each case, and have settled on using 100 as a reasonable compromise between speed and accuracy. We have calculated q values for 120 separate hands, and the results make for fascinating study. Consider that it is a good strategy to fold a bad hand as soon as possible; but knowing when you have a bad hand is a bit of a challenge. Pre-flop, for example, an Ace-Queen is a topnotch combination and is a sure stay, although not a sure winner. On the other hand, two-six unsuited (of different suits) is a very poor bet, but not a sure loser. The q1 statistics show that there is only a very weak correlation between the so-called value of a hand at that point in the betting and the final result. This is because there is only a very weak correlation between the values q1 and q4 for any hand. At pre-flop your poor two-six combination has almost as good a chance of being a winner as the Ace Queen. But if you were to play the game based on the q1 scores, and always waited for such a good pre-flop before you bet, you might as well be at the slots, because you will be constantly be putting money in the pot and never getting anything back. Yet, there are quite a few hands with relatively poor q1 scores where the q4 shows a value over 70. This says very clearly that the q1 score is poor in predicting a win or loss in a game. But we can also look at the relationship between q2 and q4. These results are shown here in Figures 2.
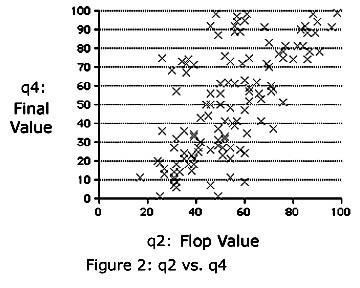
Figure 2 shows a completely different story. The q2 value, calculated when there are three table cards showing, is a much better predictor of q4, the final score. With eyes only, without fancy statistical analysis, you can see the relationship, with the points grouped along a line going from the lower left to the upper right. Let’s say that you choose to stay in the game with a q2 of 66 or better. Now you will be staying about a third of the time, and you will definitely increase the chances of ending up taking home the money. We do not show the q3 vs. q4 plot for lack of space and time, and because the story is the same. As you would expect, q3 is better than q2 as a predictor of final outcome, but only marginally. The second round of betting, after the flop, appears to be the best time to fish or cut bait, but we will have to wait and see on that point. Our q values will eventually play a big role in developing a betting strategy, but looking ahead, something should be obvious: a betting strategy that is based only on hand values is a loser. A smart competing player can simply keep raising until you fold. A programmed method for playing the game must employ deception just as a real player would. In fact, hand evaluation and betting strategy may be two different animals entirely, and it may be necessary to separate the two. Since this series of articles is being done in real time, and since I haven’t yet figured out how to do this, it may take more than a month for this to work out; so part 5 will come along, but only when it is ready. Richard Ten Dyke has previously contributed to this newsletter on the topic of Digital Photography and computer creativity. He is retired from IBM and can be reached at tendyke@bedfordny.com. All opinions are his own, and he welcomes comments. © 2006 Richard P. Ten Dyke |